
Every offline and online casino game has a house edge: if a person wagers $100, then the house edge predicts the return on that $100 the player will receive, on average. For example, playing roulette, the player will receive about $94.74. Playing live blackjack, the player gets back about $99.54. Playing Three Card Poker (just the Ante/Play), the player gets back about $96.63. These values are the “average return” the player gets when he makes an initial wager of $100, and they correspond to the house edge for each game.
Of course, a player never gets exactly $94.74, or $99.54, or $96.63 back at the end of a round. He may lose his wager of $100, he might push, or he might win $100, $200, or something else can happen. For example, if the player placed $100 on 34-red in roulette and won, he would win $3,500. If a blackjack player split to four hands, doubled on each, and then watched as the dealer pulled a six-card 21 beating him on all hands, then the player would lose $800. Each time a round completes, the amount the player actually wins or loses will be a value that is usually different than the average return he expects. Over the long run, these different returns will average out. The average return is the ratio of the sum of all the returns to the sum of all the initial bets.
We need a measurement of how wildly the various returns on individual rounds of a casino game are from the average return. That’s where the standard deviation and variance come in.
The standard deviation of some data can be intuitively thought of as “the average distance of a data value from the average of the data.” It is customary to use the Greek letter σ to denote the standard deviation. A data value means one of the pieces of data collected. Some of the data values will be less than the average of the data; some of the data values will be greater than the average of the data. Some may equal the average. Each data value is a certain distance from the average of the data. The point here is to find the “average” of the distance from the average.
There is a technical aspect to the standard deviation that comes from what it means to find the “average.” We illustrate this technicality by first considering two methods of finding the average of values X and Y.
One notion of an average of two values X and Y is to compute the value (X + Y)/2. For example, with X = 3 and Y = 5, the average is (3 + 5)/2 = 8/2 = 4. This method of computing the average is known as computing the “arithmetic mean”.
Another way of taking the average of two values X and Y is to take the square root of the average of the sum of the squares. That is, the average is sqrt((X2 + Y2)/2). For example, with X = 3 and Y = 5, the second way gives sqrt((32 + 52 )/2) = sqrt(34/2) = 4.12. Note this is slightly larger than 4, the arithmetic mean. This method of computing the average is known as computing the “root mean square”.
With more values, a similar method is used to compute these averages. For example, with the values 3, 7, 8, 2, the arithmetic mean is (3 + 7 + 8 + 2)/4 = 5. Similarly, the root mean square is sqrt((32 + 72 + 82 + 22)/4) = sqrt((9 + 49 + 64 + 4)/4) = sqrt(126)/4 = 5.61. Again, note that the root mean square is slightly larger than the arithmetic mean. For the standard deviation, the average is computed using the second of these methodologies. The reason is that some of the deeper theorems rely on subtle properties the root mean square has that the arithmetic mean does not have.
TO COMPUTE THE STANDARD DEVIATION OF SOME DATA:
1. Find the arithmetic mean of the data. 2. Find the distance of each value from the arithmetic mean. 3. Square each of these distances. 4. Compute the arithmetic mean of the squares. 5. Take the square root of the value in step 4.
FOR EXAMPLE, THE STANDARD DEVIATION OF THE VALUES 3, 7, 8 AND 2 IS FOUND AS FOLLOWS:
1. The arithmetic mean is (3 + 7 + 8 + 2)/4 = 5. 2. The distance of each number from 5 is: -2, 2, 3, and -3. 3. The square of these distances gives the values 4, 4, 9 and 9. 4. The arithmetic mean of the squares gives (4 + 4 + 9 + 9)/4 = 26/4. 5. The square root of the value obtained from step 4 is sqrt (26/4) = 2.55.
So, the standard deviation of the data 3, 7, 8 and 2 is 2.55. When this definition is applied to a casino game, the standard deviation is “the average distance between the result of a round of a casino game and the average return (theoretical RTP) for that game.” In other words, we look at the various returns a casino game has, the different outcomes that are possible for the player, and ask: “on average how far away are those returns from the expected theoretical return?” The answer is the “standard deviation,” As previously mentioned, we denote this value σ. Along with the “standard deviation,” the concept of “variance” and “volatility” are usually described. Variance is defined to be the square of the standard deviation, that is, variance = σ2. It is the value obtained at step #4 in the computation of the standard deviation. The purpose of introducing the variance is that many mathematical computations are easier, for very technical reasons, when applied to the variance.
 We will use the word “variance” casually, with the understanding that it is really measuring the same thing as the standard deviation: just take the square root of the variance to get the standard deviation. Among the many reasons that authors, players, casino management, and game developers prefer the word “variance” is that it is shorter, easier to write, less technical sounding, and has fewer syllables than “standard deviation.” It is more intuitive to say a game has “high variance” than to say it has “high standard deviation”. Finally, volatility is often used as a synonym for either the standard deviation or variance, depending on the context. Volatility is also used informally to describe the degree of unpredictability in a measurement or in a financial exchange, like gambling. Phrases like “high volatility” are usually applied to financial instruments with big up and down swings. Similarly, “low volatility” suggests gradual movement. Intuitively, the larger the value of the standard deviation (variance, volatility), the more the data is spread out, or deviates from the average. A standard deviation (variance, volatility) of zero means that every piece of data has the same value as the average for all the data. We are going to explore these issues by comparing a day-job to an experience playing a casino game.
Suppose you work at a job and your paycheck is $1,500 per week. You quickly come to rely on the steadiness of that income. You make choices about purchases, vacations, health care and other matters based on knowing an exact amount of cash that will be paid to you on a certain date. Any time the data points are all the same, the standard deviation is zero. Because the only data point is $1,500, your average salary each Friday is $1,500. The standard deviation is σ = $0.00. We’re going to experiment with a few more ways of getting paid. All of these methods have the same expected salary: getting paid $1,500 per week over the long run.
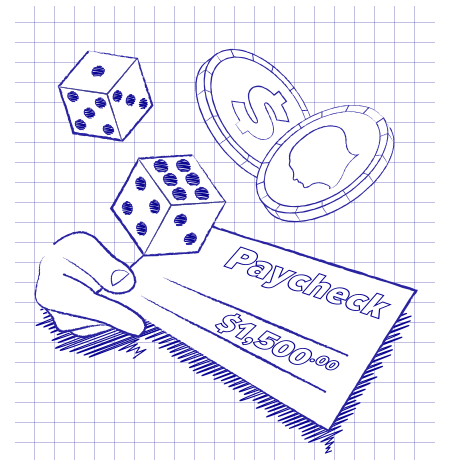
1. Suppose each Friday you roll a single six-sided dice to determine your weekly paycheck. Your pay is $0 if a “1” is rolled; $500 if a “2” is rolled; $1,000 if a “3” is rolled; $2,000 if a “4” is rolled; $2,500 if a “5” is rolled; and $3,000 if a “6” is rolled. Then your average salary is: ($F0 + $500 + $1,000 + $2,000 + $2,500 +$3,000) / 6 = $1,500. Using steps 1 - 5 given above, the standard deviation is σ = $1,080.23.
2. Suppose each Friday you flipped a coin. Heads, you get $3,000 and tails you get nothing. Clearly your average salary is $1,500, so over the long run you are earning the same amount. The standard deviation is σ = $1,500.00
3. Suppose each Friday you roll a single six-sided dice to determine your weekly paycheck. Your pay is $0 if the dice shows a 1, 2, 3, 4, or 5. You get paid $9,000 if the dice shows a 6. Your average salary is ($0 + $0 + $0 + $0 + $0 + $9 000) / 6 = $1,500. The standard deviation is σ = $3,354.10.
4. Finally, suppose each Friday you roll two dice. If the sum is 12 you get paid $54,000. For any other sum of the two dice, you get paid $0. You can do the math or not, but on aver age your pay is $1,500 per week. The standard deviation is σ = $8,874.12.
I would be very uncomfortable having a day job and not knowing come Friday if I will get paid or not. I want to know that fifteen hundred dollars will be in my hand. If I wanted to gamble with the least volatility, then using method 1 would be the choice. If I wanted to gamble on my salary with the greatest volatility, then method 4 would be the choice. Most of us want no variance at all when it comes to our day job. Turning this around, when people play a casino game, they are willing to pay the casino a certain fraction of their wagers in order to get have an experience of variance that suits their comfort level. The product the customer is purchasing is the variance and the adrenaline rush that comes with it. No one would play a zero variance slot where every single time they pulled the handle, they lost 5 cents on their $1 wager. Nor would players enjoy wagering $1 in the machine that says “Change” with its 0% house edge and zero variance. Both of these zero variance games sound pretty dumb. However, players have been knows to play with zero variance on roulette – they play the same wager on all 38 numbers; this scheme loses just over 5 cents for every dollar wagered. Players do this, for example, as a way to earn free drinks or other comps. Likewise, simultaneously playing the Banker and the Player at baccarat, or both the Pass and Don’t Pass wagers in craps are situations with very low volatility: most rounds a specific amount corresponding to the house edge is lost.
LET’S LOOK AT THE STANDARD
DEVIATION FOR THE TWO LOTTERIES.
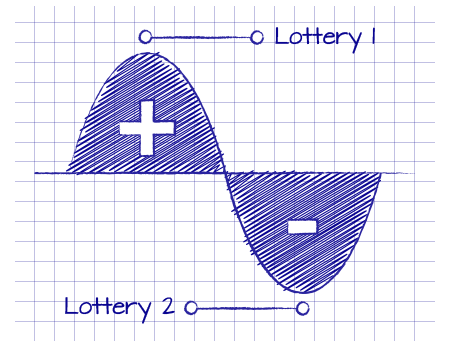
Lottery 1. For 9 data points, we have a value $100,000 as the data value, and for 999,991 data points we have a value $0 as the data value. The standard deviation is σ = $300.00 (the variance is σ2 = $89,999.19).
Lottery 2. For 900,000 data points, we have a value $1 as the data value, and for 100,000 data points we have a value $0 as the data value. The standard deviation is σ = $0.30 (the variance is σ2 = $0.09).
For most players, the variance for lottery 1 is too high and the variance for lottery 2 is too low. Players like a range of variance in their casino games. Sometimes high variance will sell, but low variance almost never sells. Just as customers don’t want variance when it’s part of their income, customers do want variance when it’s part of gaming entertainment. For most of us, our comfort level for our weekly paycheck is a variance of $0. But when a player sits down at a casino game, it’s all about variance. Variance creates excitement. Variance drives the adrenaline rush. Variance is the product.
