

The rumor of the death of table games has not been exaggerated, at least in Nevada. For many years the slow creep of slots into the real estate once held tightly by tables was barely noticeable. But, beginning in 2007, at the peak of the housing crash and beginning of the financial collapse, table games have taken a huge hit. The future of table games in unclear. Certainly baccarat has a bright future. Roulette appears to be a stable fixture. Beyond that, it is not clear if any game, including blackjack and craps, will survive the decimation.
The following graphs were created using data on gaming revenue information published by the Nevada State Gaming Control Board at this website:
http://gaming.nv.gov/index.aspx?page=149
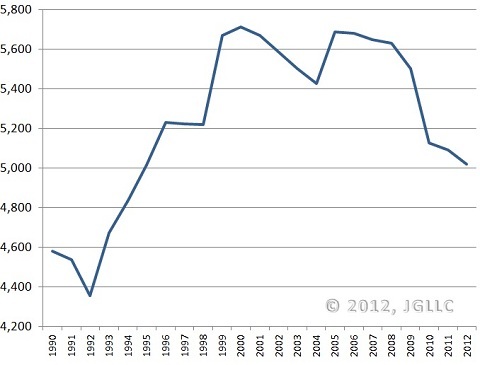
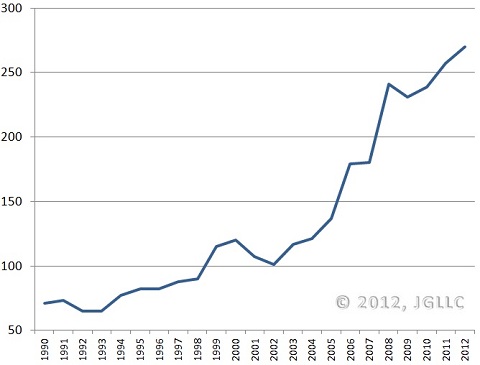
To begin with, the following graph gives the total number of tables for all table games in Nevada by year. There are 628 fewer tables in 2012 than in 2007.
Nevada: All Table Games, 1990 to 2012
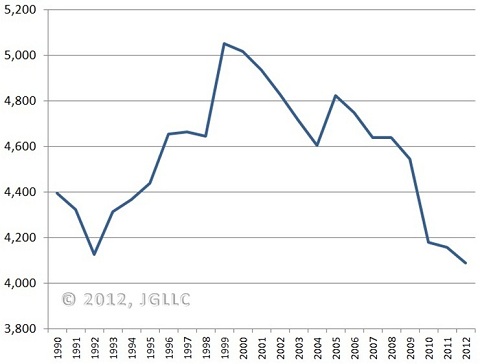
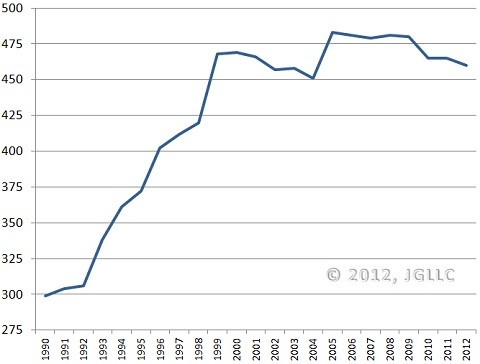
The following graph gives the total number of traditional table games in all casinos in Nevada by year. Traditional games include blackjack, craps, roulette and baccarat.
Nevada: Traditional Table Games, 1990 to 2012
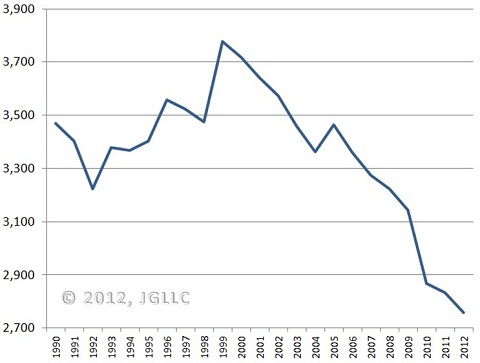
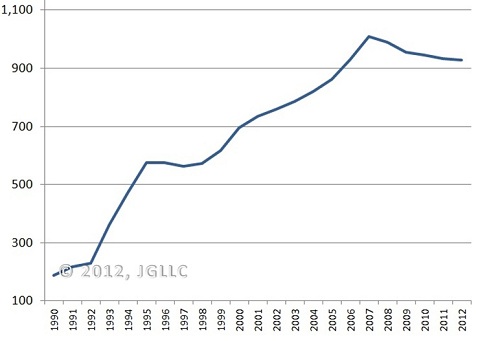
The following graph gives the total number of blackjack tables in all casinos in Nevada by year. The totals do not include proprietary variants like Blackjack Switch or Super Fun 21. However, it does include 6/5 blackjack.
Nevada: Blackjack Tables, 1990 to 2012
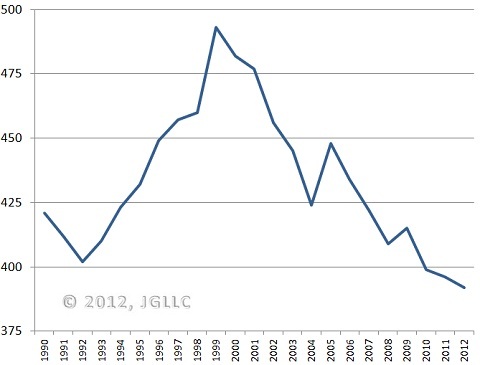
The following graph gives the total number of craps tables in all casinos in Nevada by year. Like blackjack, it appears that craps has peaked and is fading fast.
Nevada: Craps Tables, 1990 to 2012
The following graph gives the total number of baccarat tables in all casinos in Nevada by year. These tables do not include proprietary variants like EZ Baccarat. As I mentioned above, Baccarat is the singular bright spot.
Nevada: Baccarat Tables, 1990 to 2012
The following graph gives the total number of roulette tables in all casinos in Nevada by year. Roulette has peaked but is stable. The number of tables has stayed put in a range of about 25 tables for more than a decade.
Nevada: Roulette Tables, 1990 to 2012
The following graph gives the total number of proprietary game tables in all casinos in Nevada by year. These are games like Blackjack Switch, Three Card Poker, Ultimate Texas Hold'em and others. The market for proprietary games has apparently peaked and is in decline, having lost over 80 tables since 2007.
Nevada: Proprietary Games Tables, 1990 to 2012
I have been asked for similar information for other jurisdictions. However, such data is not easy to come by. There is no large-scale database of the games each casino offers.
To the extent that Nevada is the center of the Western gambling world, this data presents a sobering future. Protecting table games from APs may be pretty easy in 20 years: with the exceptions of baccarat and roulette, there may be very few table games left.
